2.6 ER NOTATION
There are a number of ER notations available, including Chen’s, Bachman, crow’s foot and a few others. There is no consensus on the symbols and the styles used to draw ERDs. A number of draw-ing tools are available to draw ERDs. These include ER Assistant, Microsoft Visio and Smart Draw, among others. Commonly used notations are shown in Figure 2.7.
2.7 DATA NORMALIZATION
After identifying Tables, attributes and relationships, the next logical step in database design is to make sure that the database structure is optimum. Optimum structure is achieved by eliminat-ing redundancies, various inefficiencies and update and deletion anomalies that usually occur in the unnormalized or partially normalized databases. Data normalization is a progressive process. The steps in the normalization process are called normal forms. Each normal form progressively improves the database and makes it more efficient. In other words, a database that is in second normal form is better than one in first normal form, and one in third normal form is better than one in second normal form. To be in third normal form, a database has to be in first and second normal forms. There are fourth and fifth normal forms, but for most practical purposes, a database meeting the criteria of third normal form is considered to be of good design.
2.7.1 First Normal Form (1NF)
A Table is in first normal form (1NF) if the values in each column are atomic; that is, there are no repeating groups of data.
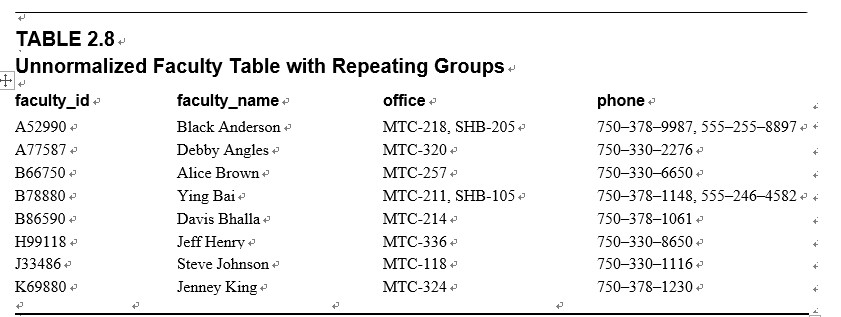
The following Faculty Table (Table 2.8) is not normalized. Some faculty members have more than one telephone number listed in the phone column. These are called repeating groups.
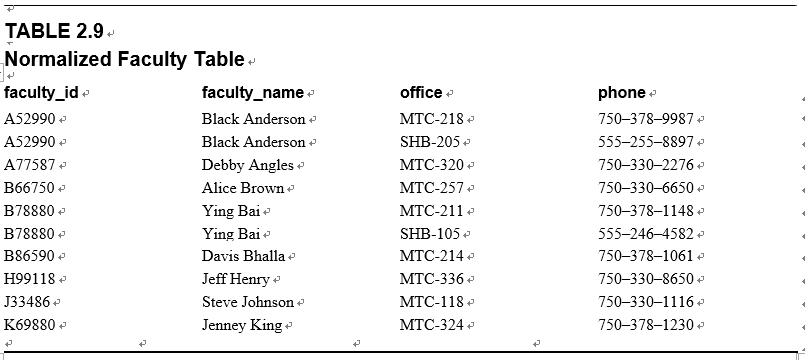
In order to convert this Table to the first normal form, the data must be atomic. In other words, the repeating rows must be broken into two or more atomic rows. Table 2.9 illustrates the Faculty Table in 1NF where repeating groups have been removed. Now it is in first normal form.
2.7.2 Second Normal Form (2NF)
A Table is in second normal form (2NF) if it is already in 1NF and every non-key column is fully dependent upon the primary key.
This implies that if the primary key consists of a single column, then the Table in 1NF is auto-matically in 2NF. The second part of the definition implies that if the key is composite, then none of the non-key columns will depend upon just one of the columns that participate in the composite key.
The Faculty Table in Table 2.9 is in first normal form. However, it has a composite primary key made up of faculty_id and office. The phone number depends on a part of the primary key, office, and not on the whole primary key. This can lead to update and deletion anomalies, as mentioned previously.
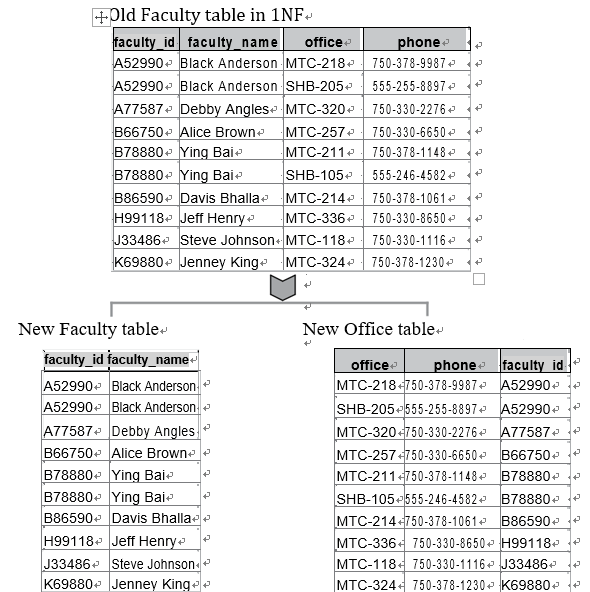
By splitting the old Faculty Table (Figure 2.8) into two new Tables, Faculty and Office, we can remove the dependencies mentioned earlier. Now the faculty Table has a primary key, faculty_id, and the Office Table has a primary key, office. The non-key columns in both Tables now depend only on the primary keys.